This is a simple step-by-step tutorial on how to setup the JMeter as a performance testing tool for an ArcGIS Server Map service and then use it. We will create a really simple test project, where we will run several identical requests based on the actual request that our application uses. When we will be done with that, we will use the JMeter Generate report to visualise the results of our test fast and (really) easy. This last step however, will happen in the next post.
I worked based on the Alex Tereshenkov blogpost about JMeter but with several amendments. The amendments were necessary because I am not interested on testing the SampleWorldCities map service and also want to get data back and not the image of the map back. If you are interested on working in Jmeter on detail, spend some time on the great blog post from Esri about the JMeter.
Installation:
First step is to install the the latest Java (64bit JRE or JDK) in your workstation. Depending on your OS there are different ways to do so. For MAC user I suggest to use Homebrew and then follow the instructions on this link or this link.
The next step is to install the JMeter. The manual way is to download the binary from the official website, move this file to your preferred location, extract it and use the bin directory files. My preferred method (for MAC users) is to use Homebrew (once again):
brew install jmeter
Or if you need plugins also:
brew install jmeter --with-plugins
And to open the application, use the following command:
open /usr/local/bin/jmeter
Or you can directly run JMeter on the same terminal:
Test Preparations
When you open the JMeter you will get the bellow screen. In my case, the GUI colours are amended to dark, so ignore the colour style of the software. If you would like to change the theme, you can always switch through the ‘Options->Look and Feel’ menu.

The first thing to do is to amend the name of the test plan. Use a name that makes sense for the test you are going to perform, like “PerformanceTest”. Then right-click on the name and Add>Threads(Users)>Thread Group.
The Thread Group is the group of users that you are going to use in order to test. In this Group you can define their behaviour. Use the details as detailed below. We are using 50 users, which are building up to the full number of 50 in 2 minutes (120sec). We define that if an error occurs the test should continue. Also the test will be finalised based on a time trigger and not on specific loop count.
- Action to be taken after a Sampler error: Continue
- Number of Threads (users): 50
- Ramp-Up Period (in seconds): 120
- Loop Count: Forever
- Scheduler is used with Duration (seconds): 7200
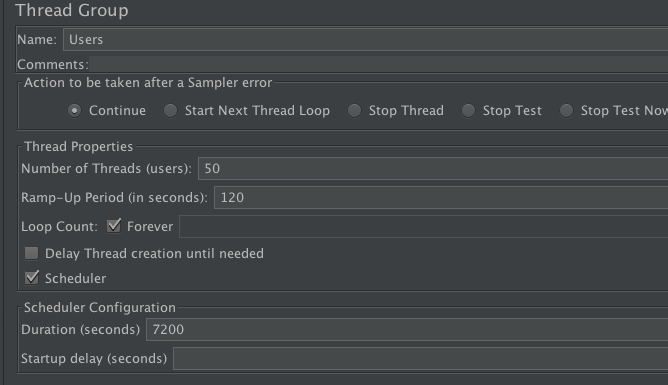
Thread Group Configuration
The next step is to include the HTTP request by Right-Click on the Users>Add>Sampler>HTTP Request. In the HTTP Request you define the details of the GET call you want to test/perform on the service. The best way to define the call is to open your application and check the actual GET call that is used. In this way you will have precise results on the GET call used. If there are multiple call you can use multiple HTTP Requests. The details defined are:
- Protocol: https (it could be http)
- Server Name or IP: <<SERVER NAME>> (ex. sampleserver6.arcgisonline.com)
- Port Number: <<PORT NUMBER>>
- Method: GET (it could also be POST method, but this is not explained here)
- Path: <<GET CALL>> (ex. arcgis/rest/services/sensors/MapServer/0/query?f=json&resultOffset=0&resultRecordCount=1000&
where=1%3D1&
outFields=ESRI_OID%2CTIME%2CVALUE&
outSR=4326&
spatialRel=esriSpatialRelIntersects
- Parameters (only if token required):
- Name: token
- Value:<<TOKEN Value>>
- Include Equals: Check
Please note that in case login is required on the ArcGIS Server, you will need to have a generated token as explained in the ESRI documentation.
In this step the test is ready but it is very important to create some listeners, which will be the “direct feedback” to us. We need the listeners to understand how the test goes in real-time. The below listeners are just a few listeners that I find very convenient and helpful to use. I highly recommend you to use them all and try to find you ideal combination. So, add a listener by Right-Click on the HTTP Request>Add>Listener. The listeners I am using are:
- View Results Tree: I use this to check directly the result and Request/Response data. As you can see in the image below the green icon gives you an instant feedback that the Request/Response is successful with details on the timings etc. Also, you can check the exact message on the Request or Response Data tab.
- Summary Report: A single line which gives you an overview of the test.
- Response Time Graph: Very useful listener in order to check the response times throughout the test. There are many options to be amended in case you want a “fancy” result. I am just setting the Interval (in ms) to the appropriate number and check the view. For example in a 2 hrs test a resonable interval is the 10000ms (10 sec). Please note that the time graph does not automatically refresh.
- Simple Data Writer: This listener records details in a file (.xml or .jtl or .csv) , based on the configuration as you define. In case you want to use the Generate report functionality, the configuration should be left as default! Of course you can set multiple listeners and check in different formats and types.

Thread Group Configuration

Simple Data Writer configuration
Running the test
Whenever you are ready press the Start Button. You can instantly check the View Results Tree if it works and fix this in case it doesn’t. The Response Time Graph will give a good idea of how the ArcGIS Server performs in real time.
If something is not working, you can always re-run the test. This might happen a lot during set-up of the test. Use the Reset Search Button and the Clear All Button on top to clean the results and re-run.
You can run the test without opening the GUI. Several websites explain this process like this one. This is very helpful when you want to automate the testing procedure. Just navigate to your project folder and use:
jmeter -n -t "<<FILE NAME>>.jmx"
Please note that if you copy-paste the terminal might not encode the correct character and you get an error as explained here. So, type the command.
On this next post we will use the JMeter Generate report to visualise the results of our test. Have fun!


